splunk-bots-v3 write up(1)
Splunk BOTS의 데이터셋은 3개입니다.
- BOTS란?
- BOTS v1 Write up(1)
- BOTS v1 Write up(2) - END
- BOTS v2 Write up(1)
- BOTS v2 Write up(2)
- BOTS v2 Write up(3)
- BOTS v2 Write up(4)
- BOTS v2 Write up(5) - END
- BOTS v3 Write up(1)
- BOTS v3 Write up(2)
- BOTS v3 Write up(3)
- BOTS v3 Write up(4) - END
- BOTS v4 결과
- secnario #1
Note: All the information you need to answer each question is present within the question itself. You just need to figure out how to create the proper splunk search query that will get you the information you want.
각 질문에 답하는 데 필요한 모든 정보는 질문 자체에 있습니다. 원하는 정보를 얻을 수 있는 적절한 splunk 검색 쿼리를 생성하는 방법을 알아내기만 하면 됩니다.
BOTS-V3
index=botsv3의 sourcetype은 아래와 같습니다.
| metadata type=sourcetypes index=botsv3
| stats values(sourcetype)
- sourcetype 목록
| values(sourcetype) |
|---|
| PerfmonMk:Process |
| Script:GetEndpointInfo |
| Script:InstalledApps |
| Script:ListeningPorts |
| Unix:ListeningPorts |
| Unix:SSHDConfig |
| Unix:Service |
| Unix:Update |
| Unix:Uptime |
| Unix:UserAccounts |
| Unix:Version |
| WinHostMon |
| access_combined |
| alternatives |
| amazon-ssm-agent |
| amazon-ssm-agent-too_small |
| apache_error |
| aws:cloudtrail |
| aws:cloudwatch |
| aws:cloudwatch:guardduty |
| aws:cloudwatchlogs |
| aws:cloudwatchlogs:vpcflow |
| aws:config:rule |
| aws:description |
| aws:elb:accesslogs |
| aws:rds:audit |
| aws:rds:error |
| aws:s3:accesslogs |
| bandwidth |
| bash_history |
| bootstrap |
| cisco:asa |
| cloud-init |
| cloud-init-output |
| code42:api |
| code42:computer |
| code42:org |
| code42:security |
| code42:user |
| config_file |
| cpu |
| cron-too_small |
| df |
| dmesg |
| dpkg |
| error-too_small |
| errors |
| errors-too_small |
| ess_content_importer |
| hardware |
| history-2 |
| interfaces |
| iostat |
| lastlog |
| linux_audit |
| linux_secure |
| localhost-5 |
| lsof |
| maillog-too_small |
| ms:aad:audit |
| ms:aad:signin |
| ms:o365:management |
| ms:o365:reporting:messagetrace |
| netstat |
| o365:management:activity |
| openPorts |
| osquery:info |
| osquery:results |
| osquery:warning |
| out-3 |
| package |
| protocol |
| ps |
| stream:arp |
| stream:dhcp |
| stream:dns |
| stream:http |
| stream:icmp |
| stream:igmp |
| stream:ip |
| stream:mysql |
| stream:smb |
| stream:smtp |
| stream:tcp |
| stream:udp |
| symantec:ep:agent:file |
| symantec:ep:agt_system:file |
| symantec:ep:behavior:file |
| symantec:ep:packet:file |
| symantec:ep:risk:file |
| symantec:ep:scm_system:file |
| symantec:ep:security:file |
| symantec:ep:traffic:file |
| syslog |
| time |
| top |
| usersWithLoginPrivs |
| vmstat |
| who |
| wineventlog |
| xmlwineventlog |
| yum-too_small |
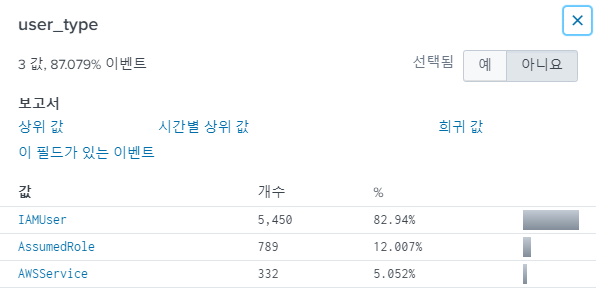
200 List out the IAM users that accessed an AWS service (successfully or unsuccessfully) in Frothly’s AWS environment? Answer guidance: Comma separated without spaces, in alphabetical order. (Example: ajackson,mjones,tmiller)
Frothly의 AWS 환경에서 AWS 서비스(성공 또는 실패)에 액세스한 IAM 사용자를 나열합니까? 답변 안내: 알파벳 순서로 공백 없이 쉼표로 구분됩니다. (예: ajackson,mjones,tmiller)
hint#1
Use aws:cloudtrail as the sourcetype.sourcetype aws:cloudtrail에서 찾으세요
hint#2
Look at the values within the user_type field. user_type의 값을 보세요.sourcetype=*aws:* *IAM*
user_agent field를 보면 IAMUser란 값이 보입니다.
user라는 필드가 눈에 띄니 보도록 합시다.
sourcetype=*aws* *IAM* user_type=IAMUser
| dedup user
| table user
| sort -user
| user |
|---|
| bstoll |
| btun |
| splunk_access |
| web_admin |
답 : bstoll,btun,splunk_access,web_admin
201 What field would you use to alert that AWS API activity have occurred without MFA (multi-factor authentication)? Answer guidance: Provide the full JSON path. (Example: iceCream.flavors.traditional)
MFA(다중 요소 인증) 없이 AWS API 활동이 발생했음을 알리기 위해 어떤 필드를 사용하시겠습니까? 답변 안내: 전체 JSON 경로를 제공하세요. (예: iceCream.flavors.traditional)
hint#1
Use aws:cloudtrail as the sourcetype.sourcetype aws:cloudtrail를 살펴보세요.
hint#2
Check out the AWS docs: https://docs.aws.amazon.com/awscloudtrail/latest/userguide/cloudwatch-alarms-for-cloudtrail-additional-examples.html#cloudwatch-alarms-for-cloudtrail-no-mfa-exampleAWS 공식문서를 참고하세요. https://docs.aws.amazon.com/awscloudtrail/latest/userguide/cloudwatch-alarms-for-cloudtrail-additional-examples.html#cloudwatch-alarms-for-cloudtrail-no-mfa-example
hint#3
Make sure you are not including console login activity.콘솔 로그인 활동을 포함하지 않았는지 확인하십시오.
CloudTrail은 AWS 환경에서 수행 된 모든 작업의 로그입니다.
clouldtrail에서 MFA 관련 로그를 찾아봅시다.
sourcetype=aws:cloudtrail *MFA*
쿼리 결과를 보면 mfamfaAuthenticated라는 필드를 볼 수 있습니다.
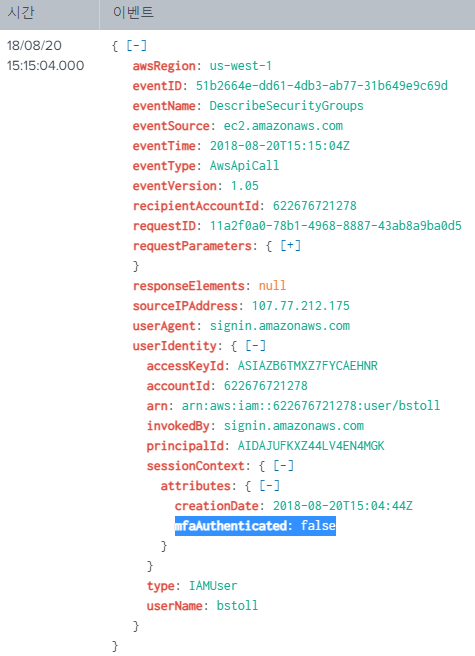
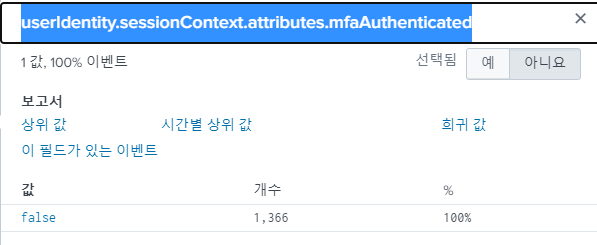
AWS 공식문서에 해당 필드가 MFA 사용여부를 확인하는 필드임을 확인할 수 있습니다.
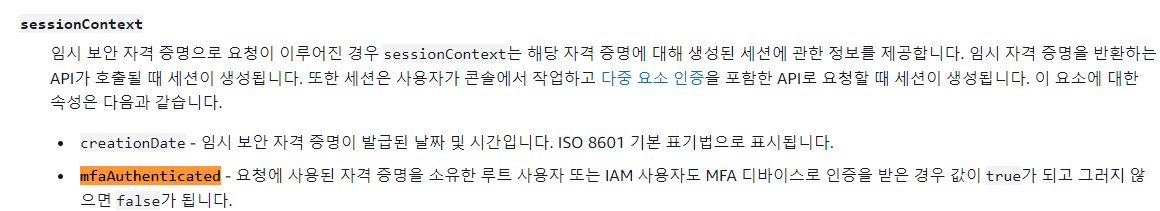
답 : userIdentity.sessionContext.attributes.mfaAuthenticated
202 What is the processor number used on the web servers? Answer guidance: Include any special characters/punctuation. (Example: The processor number for Intel Core i7-8650U is i7-8650U.)
웹 서버에서 사용되는 프로세서 번호는 무엇입니까? 답변 안내: 특수 문자/문장부호를 포함하십시오. (예: Intel Core i7-8650U의 프로세서 번호는 i7-8650U입니다.)
hint#1
Use hardware as the sourcetype for hardware information such as CPU statistics, hard drives, network interface cards, memory, and more.CPU 통계, 하드 드라이브, 네트워크 인터페이스 카드, 메모리 등과 같은 하드웨어 정보의 소스 유형으로 하드웨어를 사용합니다.
CPU 이름에 intel 혹은 amd가 포함되어있을테니 해당 키워드로 검색해봅니다.
intel OR amd
| stats count by sourcetype
| sourcetype | count |
|---|---|
| WinHostMon | 1916 |
| aws:elb:accesslogs | 430 |
| stream:http | 368 |
| access_combined | 366 |
| stream:mysql | 172 |
| aws:rds:audit | 93 |
| ms:o365:management | 63 |
| wineventlog | 29 |
| o365:management:activity | 18 |
| syslog | 8 |
| dmesg | 6 |
| osquery:results | 4 |
| aws:cloudwatchlogs | 3 |
| hardware | 3 |
| stream:udp | 2 |
| stream:smtp | 1 |
WinHostMon이 유력하지만, hardware라는 sourcetype이 눈에 띕니다. 해당 sourcetype으로 검색해봅니다.
intel OR amd sourcetype=hardware
CPU_TYPE필드 값은 다음과 같습니다. Intel(R) Xeon(R) CPU E5-2676 v3 @ 2.40GHz
답 : E5-2676
203 Bud accidentally makes an S3 bucket publicly accessible. What is the event ID of the API call that enabled public access? Answer guidance: Include any special characters/punctuation.
Bud가 실수로 S3 버킷에 공개적으로 액세스할 수 있도록 합니다. 공개 액세스를 활성화한 API 호출의 이벤트 ID는 무엇입니까? 답변 안내: 특수 문자/문장부호를 포함하십시오.
hint#1
Use aws:cloudtrail as the sourcetype. sourcetype aws:cloudtrail을 보세요.설정관련 로그는 cloudtrail에 있을것입니다. s3를 키워드로 검색해봅니다.
sourcetype=aws:cloudtrail s3
field중에 eventName이 있습니다. 어떤 eventName이 있는지 봅시다.
sourcetype=aws:cloudtrail s3
| dedup eventName
| table eventName
설정하는 이벤트(Set이 포함된 이벤트이름 등)가 있을것입니다.
- 결과
| eventName |
|---|
| DescribeConfigRuleEvaluationStatus |
| DescribeConfigRules |
| GetBucketLocation |
| GetBucketCors |
| GetBucketTagging |
| GetBucketLifecycle |
| GetBucketLogging |
| ListBuckets |
| GetBucketEncryption |
| GetBucketVersioning |
| GetBucketPolicy |
| GetBucketAcl |
| GetComplianceDetailsByConfigRule |
| PutEvaluations |
| GetBucketRequestPayment |
| GetBucketReplication |
| GetBucketWebsite |
| GetBucketNotification |
| PutBucketAcl |
| DescribeLoadBalancerAttributes |
중간에 PutBucketAcl이란 이벤트 이름이 보입니다. 해당키워드로 검색해봅니다.
Grantee.URL을 보면 AllUsers란 게있습니다.
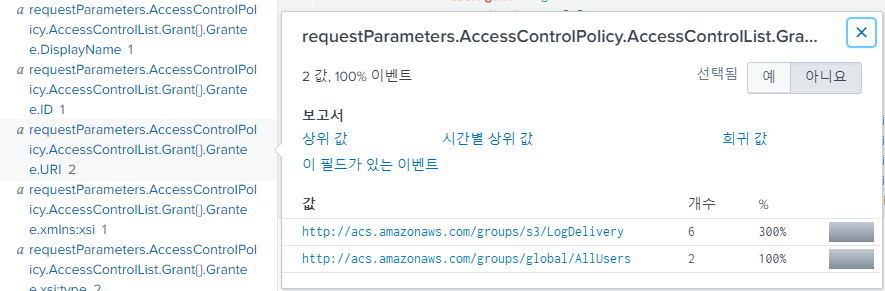
sourcetype="aws:cloudtrail" eventName="PutBucketAcl"
| table _time eventID requestParameters.AccessControlPolicy.AccessControlList.Grant{}.Grantee.URI requestParameters.AccessControlPolicy.AccessControlList.Grant{}.Permission
| _time | eventID | requestParameters.AccessControlPolicy.AccessControlList.Grant{}.Grantee.URI | requestParameters.AccessControlPolicy.AccessControlList.Grant{}.Permission |
|---|---|---|---|
| 2018/08/20 13:57:54 | 9a33d8df-1e16-4d58-b36d-8e80ce68f8a3 | http://acs.amazonaws.com/groups/s3/LogDelivery http://acs.amazonaws.com/groups/s3/ogDelivery http://acs.amazonaws.com/groups/s3/LogDelivery |
FULL_CONTROL WRITE READ_ACP READ FULL_CONTROL |
| 2018/08/20 13:01:46 | ab45689d-69cd-41e7-8705-5350402cf7ac | http://acs.amazonaws.com/groups/s3/LogDelivery http://acs.amazonaws.com/groups/s3/LogDelivery http://cs.amazonaws.com/groups/s3/LogDelivery http://acs.amazonaws.com/groups/global/AllUsers http://acs.amazonaws.com/groups/global/AllUsers |
FULL_CONTROL WRITE READ_ACP READ FULL_CONTROL READ WRITE |
AllUsers에 대한 READ, WRITE 권한이 2018/08/20 13:57:54에 빠졌습니다.
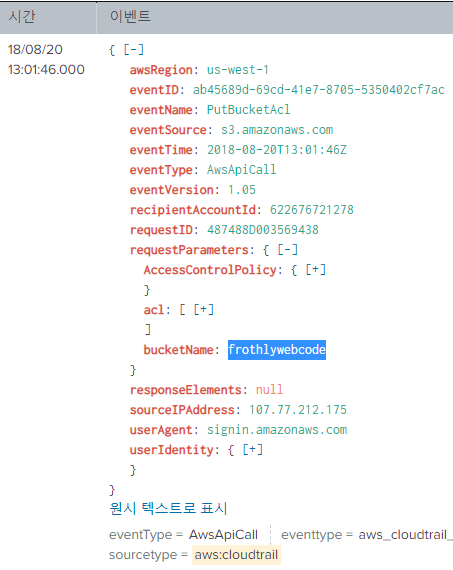
S3 Bucket이 모든사용자에게 공개된 시간은 2018/08/20 13:01:46 ~ 2018/08/20 13:57:54 입니다. 공개정책을 넣은 eventID는 ab45689d-69cd-41e7-8705-5350402cf7ac입니다.
답 : ab45689d-69cd-41e7-8705-5350402cf7ac
204 What is the name of the S3 bucket that was made publicly accessible?
공개적으로 액세스할 수 있게 된 S3 버킷의 이름은 무엇입니까?
hint#1
Use aws:cloudtrail as the sourcetype.sourcetype aws:cloudtrail에서 찾으세요.
https://docs.aws.amazon.com/awscloudtrail/latest/APIReference/API_Trail.html
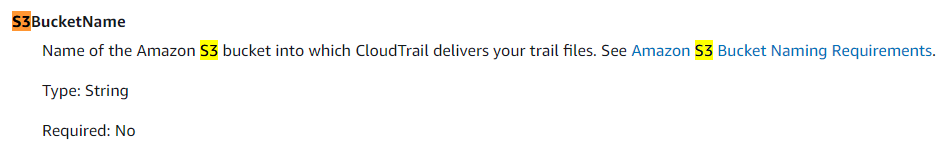
splunk 로그에서는 S3BucketName이 아닌, bucketName 입니다.
203번문제에서 발생한 bucketName은 frothlywebcode 입니다.
205 What is the name of the text file that was successfully uploaded into the S3 bucket while it was publicly accessible? Answer guidance: Provide just the file name and extension, not the full path. (Example: filename.docx instead of /mylogs/web/filename.docx)
공개적으로 액세스할 수 있는 동안 S3 버킷에 성공적으로 업로드된 텍스트 파일의 이름은 무엇입니까? 답변 안내: 전체 경로가 아닌 파일 이름과 확장자만 제공하세요. (예: /mylogs/web/filename.docx 대신 filename.docx)
hint#1
Use aws:s3:accesslogs as the sourcetype.sourctype중 aws:s3:accesslogs가 있습니다. 여기서 frothlywebcode로 업로드 된 텍스트 파일을 찾아봅시다. 검색범위를 줄이기 위해 aws:s3:accesslogs의 필드를 보니 요청 성공여부를 나타내는 http_status, 수행 함수를 뜻하는 opertaion필드가 있습니다.
http_status=200, REST.PUT.OBJECT 조건을 추가로 넣어 검색해봅니다.
sourcetype=aws:s3:accesslogs frothlywebcode http_status=200 operation="REST.PUT.OBJECT" .txt
 OPEN_BUCKET_PLEASE_FIX.txt라는 이름의 텍스트 파일을 발견할 수 있습니다.
답 : OPEN_BUCKET_PLEASE_FIX.txt
206 What is the size (in megabytes) of the .tar.gz file that was successfully uploaded into the S3 bucket while it was publicly accessible? Answer guidance: Round to two decimal places without the unit of measure. Use 1024 for the byte conversion. Use a period (not a comma) as the radix character.
공개적으로 액세스할 수 있는 동안 S3 버킷에 성공적으로 업로드된 .tar.gz 파일의 크기(MB)는 얼마입니까? 답변 안내: 측정 단위 없이 소수점 이하 두 자리까지 반올림합니다. 바이트 변환에 1024를 사용합니다. 기수 문자로 마침표(쉼표 아님)를 사용합니다.
hint#1
Use aws:s3:accesslogs as the sourcetype.sourcetype aws:s3:accesslogs에서 찾으세요.
hint#1
Take a closer look at who made (or requested) the upload. 누가 업로드를 했는지(또는 요청했는지) 자세히 살펴보세요.공개된 시간은 2018/08/20 13:01:46 ~ 2018/08/20 13:57:54이므로, 해당 시간안에 .tar.gz 확장자의 파일이 업로드된 이벤트를 탐색해봅시다.
sourcetype=aws:s3:accesslogs frothlywebcode http_status=200 operation="REST.PUT.OBJECT" .tar.gz
object_size 필드가 눈에 띕니다.
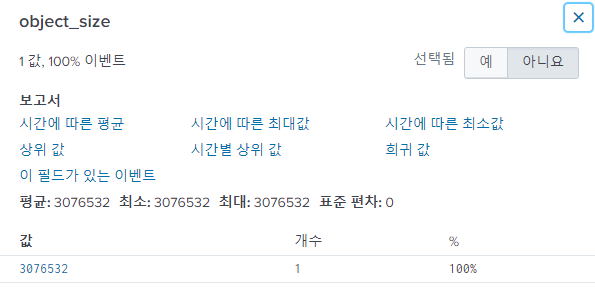 해당 값을 MiB(1024)로 변환해봅시다.
※ MiB (메비바이트 : mebibyte) :
메비바이트는 1,024키비바이트, 220(10242 = 1,048,576)바이트를 뜻하는 정보의 단위이다.
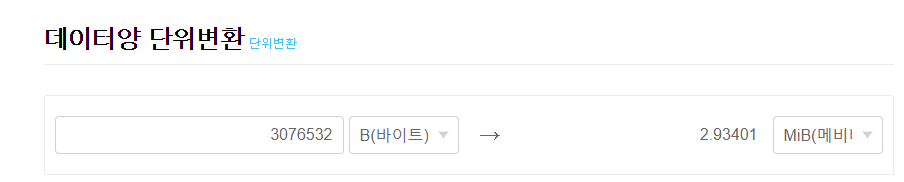
답 : 2.93
207 문제는 없습니다.
208 A Frothly endpoint exhibits signs of coin mining activity. What is the name of the first process to reach 100 percent CPU processor utilization time from this activity on this endpoint? Answer guidance: Include any special characters/punctuation.
Frothly 엔드포인트는 코인 채굴 활동의 징후를 보입니다. 이 끝점에서 이 활동에서 100% CPU 프로세서 사용 시간에 도달한 첫 번째 프로세스의 이름은 무엇입니까? 답변 안내: 특수 문자/문장부호를 포함하십시오.
hint#1
Use perfmonmk:process as the sourcetype.sourcetype perfmonmk:process에서 조사하세요.
hint#2
Which browser was in use when this endpoint visited the coin mining site(s)?이 엔드포인트가 코인 마이닝 사이트를 방문했을 때 어떤 브라우저가 사용 중이었습니까?
cpu를 포함한 process의 자원 사용률은 PerfmonMk:Process에서 찾을 수 있을것입니다. 자세한 사항은 splunk 홈페이지에서 확인 가능합니다. PerfmonMk:Process in splunk
sourcetype=perfmonmk:process
해당 sourcetype에 process_cpu_used_percent와 process_name이라는 필드가 눈에 띕니다. process_cpu_used_percent=100을 추가하고, process_name을 보도록합니다.
sourcetype=perfmonmk:process process_cpu_used_percent=100 process_name=*
| sort _time
| table _time host process_name process_cpu_used_percent
| _time | host | process_name | process_cpu_used_percent |
|---|---|---|---|
| 2018/08/20 09:36:26 | BSTOLL-L | MicrosoftEdgeCP#2 | 100 |
| 2018/08/20 13:37:50 | BSTOLL-L | chrome#5 | 100 |
| 2018/08/20 13:38:20 | BSTOLL-L | chrome#5 | 100 |
….
제일먼저 cpu가 100%인 프로세스는 MicrosoftEdgeCP#2입니다. 하지만 답은 chrome#5입니다. 근거를 찾지 못하였으니 아시는 분은 댓글로 제보 바랍니다.
답 : chrome#5
209 When a Frothly web server EC2 instance is launched via auto scaling, it performs automated configuration tasks after the instance starts. How many packages and dependent packages are installed by the cloud initialization script? Answer guidance: Provide the number of installed packages then number of dependent packages, comma separated without spaces.
Frothly 웹 서버 EC2 인스턴스가 Auto Scaling을 통해 시작되면 인스턴스가 시작된 후 자동화된 구성 작업을 수행합니다. 클라우드 초기화 스크립트에 의해 설치되는 패키지 및 종속 패키지는 몇 개입니까? 답변 안내: 설치된 패키지 수와 종속 패키지 수를 공백 없이 쉼표로 구분하여 제공하십시오.
hint#1
Use cloud-init-output as the sourcetype. sourcetype cloud-init-output를 조사해보세요.hint#1
Check out the AWS docs: https://docs.aws.amazon.com/AWSEC2/latest/UserGuide/user-data.html#user-data-cloud-init AWS 공식문서를 참고하세요 : https://docs.aws.amazon.com/AWSEC2/latest/UserGuide/user-data.html#user-data-cloud-init문제에서 auto scaling을 수행하면 인스턴스가 시작된 후 자동화 작업을 시작한다는 설명이 있습니다. 인스턴스 시작관련 로그는 clould-init에 있습니다.
could-init과 관련된 sourcetype은 cloud-init과 cloud-init-output이 있습니다.
두 sourcetype 모두 조사해보도록 합시다.
packages와 dependent를 키워드로 두고 검색해봅니다.
sourcetype=cloud-init* *packages* *dependent*
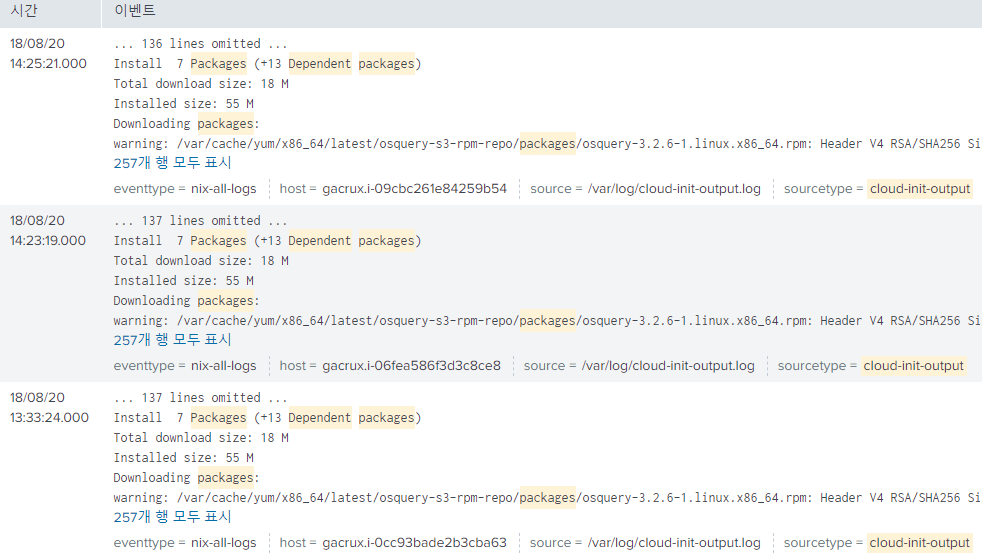
로그를 확인하면 Install 7 Packages (+13 Dependent packages) 7개의 패키지와, 13개의 의존 패키지가 설치된 사실을 파악할 수 있습니다.
답 : 7,13
210 What is the short hostname of the only Frothly endpoint to actually mine Monero cryptocurrency? (Example: ahamilton instead of ahamilton.mycompany.com)
실제로 Monero 암호화폐를 채굴하는 유일한 Frothly 엔드포인트의 짧은 호스트 이름은 무엇입니까? (예: ahamilton.mycompany.com 대신 ahamilton)
hint#1
What is the most common browser-based cryptominer?가장 일반적인 브라우저 기반 크립토마이너는 무엇입니까?
hint#2
Can you find DNS traffic with evidence of a common browser-based cryptomining technology?일반적인 브라우저 기반 크립토마이닝 기술의 증거로 DNS 트래픽을 찾을 수 있습니까?
hint#3
Is there a laptop that communicates successfully to coinhive servers?coinhive 서버와 성공적으로 통신하는 노트북이 있습니까?
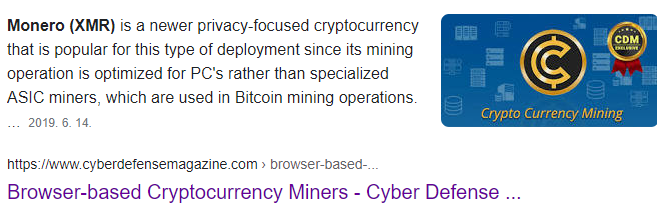
google에 browser based crypto miner를 검색해 봅시다.
다음 검색결과를 얻을 수 있습니다.
해당 사이트에서 coinhive와 Cryptojacking이 있다고 알 수 있습니다. 해당 키워드로 검색해봅니다.
208번문제에서 BSTOLL-L
coinhive
총 34개의 이벤트이고, BSTOLL-L의 이벤트가 가장 많습니다. BSTOLL-L이 모두 DNS Query관련 이벤트입니다.(21개)
Query를 질의하는 host인 BSTOLL-L이 채굴하는 host로 볼 수 있습니다.
답 : BSTOLL-L
211 How many cryptocurrency mining destinations are visited by Frothly endpoints? Frothly 엔드포인트는 얼마나 많은 암호화폐 채굴 목적지를 방문합니까?
hint#1
Use stream:dns as the sourcetype.sorucetype stream:dns에서 조사하세요.
채굴 목적지 수는 dns에서 query목록중 coinhive가 포함된 주소의 수를 찾으면 될것입니다.
sourcetype=stream:dns query=*coinhive*
| dedup query
| table query
| query |
|---|
| ws019.coinhive.com |
| coinhive.com |
| ws014.coinhive.com |
| ws011.coinhive.com |
| ws005.coinhive.com |
| ws001.coinhive.com |
총 6개의 주소를 발견할 수 있습니다.
참고로, dc함수를 이용해 이벤트 결과 수를 알아낼 수 있습니다.
sourcetype=stream:dns query=*coinhive*
| stats dc(query)
답 : 6
212 Using Splunk’s event order functions, what is the first seen signature ID of the coin miner threat according to Frothly’s Symantec Endpoint Protection (SEP) data?
Splunk의 이벤트 정렬 기능을 사용할 때 Frothly의 SEP(Symantec Endpoint Protection) 데이터에 따르면 코인 마이너 위협의 첫 번째 signature ID는 무엇입니까?
hint#1
Use symantec:ep:security:file as the sourcetype.sourcetype symantec:ep:security:file에서 조사하세요.
hint#2
First seen refers to the first event in the search results. See: https://docs.splunk.com/Documentation/Splunk/latest/SearchReference/Eventorderfunctions처음 발견한 것은 검색 결과의 첫 번째 이벤트를 나타냅니다. 참조: https://docs.splunk.com/Documentation/Splunk/latest/SearchReference/Eventorderfunctions
sourcetype 중 symantec:ep:security:file이 눈에 띕니다.
symantec:ep:security:file는 단말의 보안로그가 있다고 설명되어있습니다. Source types for the Splunk Add-on for Symantec Endpoint Protection
sourcetype symantec:ep:security:file에 Event_Description 필드에 SID라는 내용이 있습니다. 해당 sourcetype에서 우리가 눈여겨봐야할 필드는 아래와 같습니다. action CIDS_Signature_ID CIDS_Signature_String CIDS_Signature_SubID Event_Description Host_Name Remote_Host_IP severity SHA_256 signature user vendor_severity
이 필드들을 시간순서대로 살펴봅니다.
sourcetype=symantec:ep:security:file *coin*
| table _time action CIDS_Signature_ID CIDS_Signature_String CIDS_Signature_SubID Event_Description Host_Name Remote_Host_IP severity SHA_256 signature user vendor_severity
| sort _time
결과 중 CIDS_Signature_ID은 30356, 30358 두가지가 발견되었는데, _time의 값은 2018/08/20 13:37:40로 같습니다. 처음 발견된 값을 찾기위해 first함수를 사용합니다. (용법은 hint#2 참고)
sourcetype=symantec:ep:security:file *coin*
| table _time action CIDS_Signature_ID CIDS_Signature_String CIDS_Signature_SubID Event_Description Host_Name Remote_Host_IP severity SHA_256 signature user vendor_severity
| stats first(CIDS_Signature_ID)
| first(CIDS_Signature_ID) |
|---|
| 30358 |
first 함수를 이용해 제일 처음 발견된 이벤트의 SID는 30358입니다.
답 : 30358
213 According to Symantec’s website, what is the severity of this specific coin miner threat?
시만텍 웹사이트에 따르면 이 특정 코인 채굴기 위협의 심각성은 무엇입니까?
hint#1
Google search for the signature ID from the previous question and the term Symantec together.Google은 이전 질문의 signatrue ID와 Symantec이라는 용어를 함께 검색합니다.
hint#2
Symantec has an online database of all signature IDs detected by SEP here: https://www.broadcom.com/support/security-center/attacksignatures 시만텍은 SEP에서 탐지한 모든 서명 ID의 온라인 데이터베이스를 여기에서 보유하고 있습니다. https://www.broadcom.com/support/security-center/attacksignatures악성코드의 심각도를 묻는 문제입니다. 212문제에서 serverity, vendor_severity의 값을 보면 각각 high, Major란 값을 얻을 수 있습니다. 하지만 답은 6글자입니다.
시만텍 웹사이트 OSINT에서 심각도를 찾아봅니다.
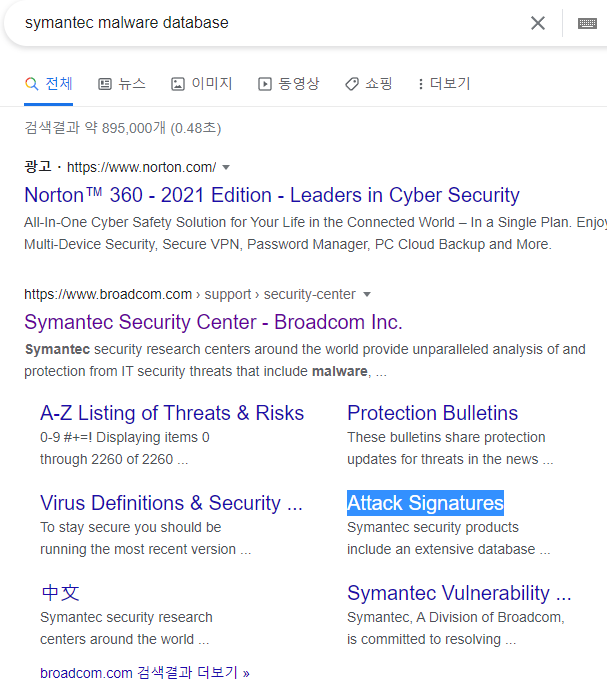 (symantec인데 도메인이 broadcom이어서 처음에 헷갈렸습니다)
Attack Signatures를 클릭합니다.
해당 검색창에 212번문제에서 파악한 JSCoinminer를 검색합니다.
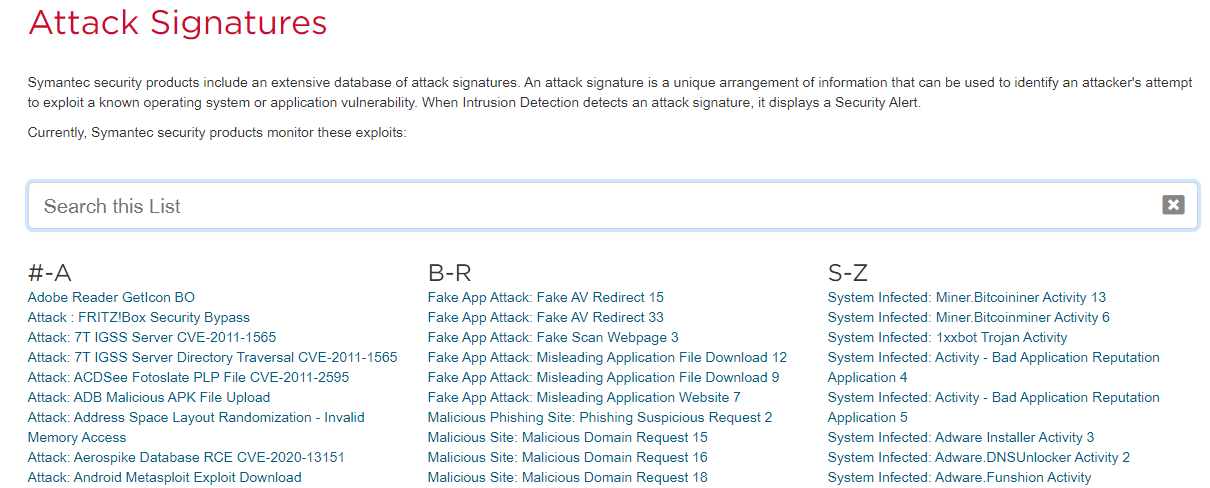
여러개가나오는데, 그중 Web Attack: JSCoinminer Download 8을 클릭합니다.
사이트에서 심각도는 Medium임을 알 수 있습니다. (Severity:Medium)
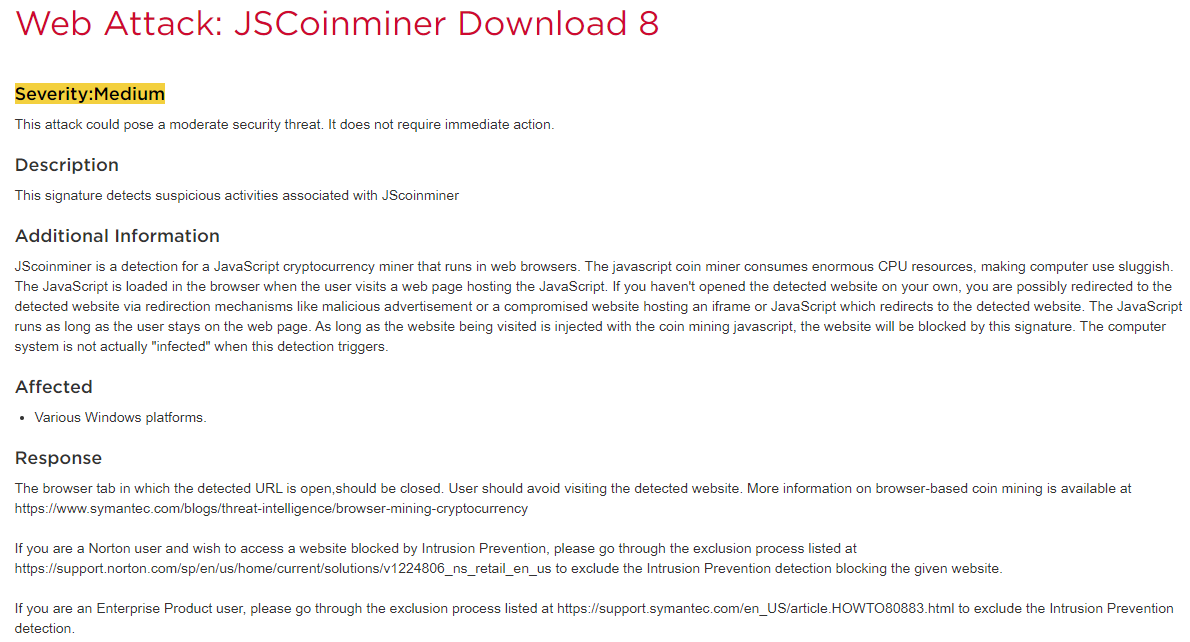
답 : Medium
214 What is the short hostname of the only Frothly endpoint to show evidence of defeating the cryptocurrency threat? (Example: ahamilton instead of ahamilton.mycompany.com)
암호화폐 위협을 물리쳤다는 증거를 보여주는 유일한 Frothly 엔드포인트의 짧은 호스트 이름은 무엇입니까? (예: ahamilton.mycompany.com 대신 ahamilton)
hint#1
Figure out what applications were blocked. The WinEventLog:Application sourcetype is helpful, as is the symantec:ep:security:file sourcetype.차단된 응용 프로그램을 파악합니다. WinEventLog:Application 소스 유형은 symantec:ep:security:file 소스 유형과 마찬가지로 유용합니다.
212번문제에서 JSCoinminer를 Block한 host는 BTUN-L입니다.
답 : BTUN-L
215 What is the FQDN of the endpoint that is running a different Windows operating system edition than the others?
다른 Windows 운영 체제 버전과 다른 버전을 실행하는 끝점의 FQDN은 무엇입니까?
hint#1
Frothly gathers system information from Cisco NVM clients on their mobile workstations.Frothly는 모바일 워크스테이션의 Cisco NVM 클라이언트로부터 시스템 정보를 수집합니다. </detail> window 혹은 OS 관련 sourcetype에 해당 데이터가 있을것으로 예상됩니다. windows를 키워드로 어떤 sourcetype이 있는지 조사해봅니다. ``` windows | stats count by sourcetype ``` | sourcetype | count | | -------------- | ----- | | WinHostMon | 72002 | | wineventlog | 47827 | | xmlwineventlog | 9212 | 상위 3개가 window와 관련된 sourcetype입니다. WinHostMon부터 조사해봅니다. WinHostMon 중 눈여겨볼 필드는 **OS ComputerName**입니다. ``` sourcetype=WinHostMon OS=* | dedup host OS ComputerName | table host OS ComputerName ``` | host | OS | ComputerName | | --------- | ------------------------------- | ------------ | | FYODOR-L | Microsoft Windows 10 Pro | FYODOR-L | | JWORTOS-L | Microsoft Windows 10 Pro | JWORTOS-L | | BSTOLL-L | Microsoft Windows 10 Enterprise | BSTOLL-L | | BTUN-L | Microsoft Windows 10 Pro | BTUN-L | | MKRAEUS-L | Microsoft Windows 10 Pro | MKRAEUS-L | | BGIST-L | Microsoft Windows 10 Pro | BGIST-L | | PCERF-L | Microsoft Windows 10 Pro | PCERF-L | | ABUNGST-L | Microsoft Windows 10 Pro | ABUNGST-L | BSTOLL-L 하나만 Enterprise버전을 사용하고 있습니다. domain을 알아야하니 BSTOLL을 키워드로 찾아봅니다.(microsoft는 로그에 없을 수도 있어 제외합니다) ``` BSTOLL "Windows 10 Enterprise" ``` sourcetype syslog에 2개의 이벤트가 있습니다. ``` Aug 20 13:37:20 splunkhwf.froth.ly fv="nvzFlow_v3" vsn="BSTOLL-L.froth.ly" udid="1DD75FEDA01F1AE457AF4307EA6DCA0946CFED56" osn="WinNT" osv="10.0.17134" ose="Windows 10 Enterprise" sm="VMware, Inc." st="x64" host=splunkhwf.froth.ly source=cisconvmsysdata sourcetype=syslog ``` vsn필드에 도메인 값이 있음을 확인할 수 있습니다. 답 : BSTOLL-L.froth.ly 216 According to the Cisco NVM flow logs, for how many seconds does the endpoint generate Monero cryptocurrency? Answer guidance: Round to the nearest second without the unit of meadsure. Cisco NVM 흐름 로그에 따르면 엔드포인트는 몇 초 동안 Monero 암호 화폐를 생성합니까? 답변 안내: 측정 단위 없이 가장 가까운 초로 반올림합니다.
hint#1
Use cisconvmflowdata as the source to give you details about network flows, including the start and end times of flows.cisconvmflowdata를 소스로 사용하여 흐름의 시작 및 종료 시간을 포함하여 네트워크 흐름에 대한 세부 정보를 제공합니다.
hint#2
In order for Monero to be mined after it is created on a laptop, the laptop must be connected to one or more mining servers.모네로가 노트북에서 생성된 후 채굴되기 위해서는 노트북이 하나 이상의 채굴 서버에 연결되어 있어야 합니다.
hint#3
Calculate the start and end times of communication to the mining servers according to the NVM fields. Then calculate the delta between the first and last communications. This can all be done within a Splunk search.NVM 필드에 따라 마이닝 서버와의 통신 시작 및 종료 시간을 계산합니다. 그런 다음 첫 번째 통신과 마지막 통신 간의 델타를 계산합니다. 이 모든 작업은 Splunk 검색 내에서 수행할 수 있습니다.
hint#1
Use stream:smtp as the sourcetype to find details of emails between Frothly employees.stream:smtp를 소스 유형으로 사용하여 Frothly 직원 간의 이메일 세부 정보를 찾습니다.

Leave a comment